Challenge
The project Site is the former CS & T Dry Cleaner located on the northeast side of Columbus, Indiana. Soil and groundwater contaminated with Perchloroethene (PCE) was discovered at the Site during a Phase I Investigation performed in 2002. Initial remediation activities using in-situ chemical oxidation were successful in removing a significant portion of the source area of the impacted groundwater plume. However, a significant dissolved plume of organic chemicals remained associated with the Site. In an effort to bring the remedial efforts to an effective closure, Mundell was retained by a partnering consulting firm to evaluate the stability of the dissolved organic plume using groundwater flow and chemical transport modeling. Modeling activities were completed in 2007 utilizing published three-dimensional analytical transport solutions (Domenico and Robbins, 1985; Domenico, 1987) to model the transport of residual contamination in the plume. Using these calibrated results, a comparison between the computer software BIOCHLOR and the utilized 3D analytical transport solution was conducted. Numerous sets of simulations were completed using both modeling methods to determine if they yield comparable results using the same hydraulic inputs. In addition, attempts were made to duplicate the calibrated analytical model results varying solely hydraulic conductivity and the retardation factor (r-factor) within the BIOCHLOR solution.
Action
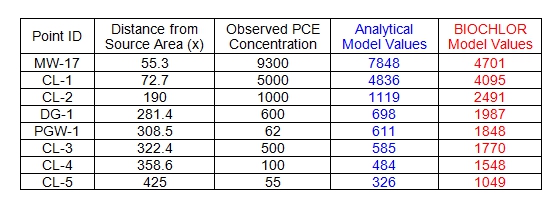
Upon formulation of a calibrated 3D analytical flow model, identical hydraulic values were utilized in BIOCHLOR to predict center-line concentrations with increasing distance from the source area. Comparison between the simulated PCE concentrations (3D analytical and BIOCHLOR) and the observed PCE concentrations indicated that the fit of the 3D analytical model values to the observed PCE values is significantly better than that of the BIOCHLOR results.

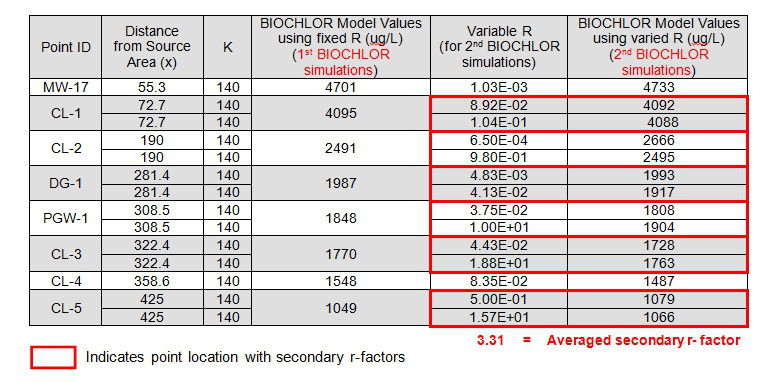
The second set of simulations used identical input parameters as both the previously run 3D analytical and BIOCHLOR simulations with the EXCEPTION of the hydraulic conductivity and r-factor. Attempts were made to set the K value at a more reasonable level (140 ft/d vs. 9 ft/d) and then adjust the r-factor until results similar to the first BIOCHLOR runs were attained.

As displayed above, several calibration points had multiple r-factor/K combinations that produced PCE concentrations similar to those calculated in the first BIOCHLOR simulations. Unfortunately, variation of the r-factor within a single transport model is not realistic, nor is it supported in either the 3D analytical model or in the BIOCHLOR spreadsheet. Averaging the secondary r-factors to create a single representative value was attempted and input into BIOCHLOR (R = 3.31). Use of this averaged r-factor did not duplicate the earlier BIOCHLOR results, and produced error values in excess of 43%.
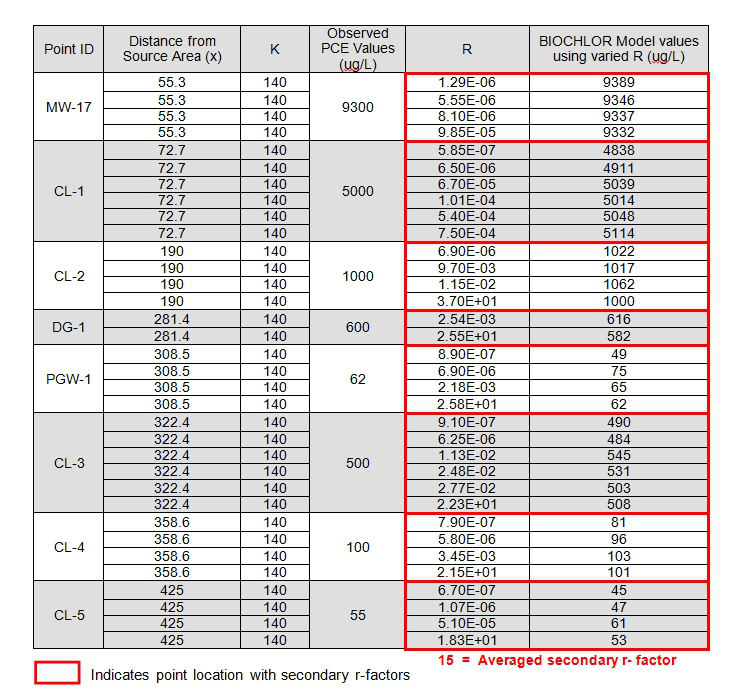
An additional attempt to obtain a secondary r-factor was completed by comparing BIOCHLOR simulated PCE concentrations to PCE concentrations observed in the field.

As in the previous analysis, no single r-factor was attained that consistently reproduced similar results to the initial r-factor/K combination, with error values again extending above 40%.
Results
Examination of both BIOCHLOR simulations showed similar error values when using the secondary r-factor values. However, the difference between the BIOCHLOR simulation errors and the 3D analytical solution errors are significantly different (an order of magnitude or more) and support the use of the 3D analytical solution as the best predicative method for the Site.
Based on these variations, it does not appear that multiple unique solutions can be attained for a single model solely by adjusting the K and r-factor.


